
Factory energy management
Bring the whole plant’s energy into one view
and cut waste and emissions together
Why it matters
A plant runs on electricity, gas, steam and water at once. That consumption is recorded per department,
per machine and per hour, scattered enough that where it goes and why is never visible at a glance.
Without the whole flow you cannot say where to cut, and savings stay a guess.
Data and signals
Where the waste hidesHow Refinery solves it
Meter everything together
Electricity, gas, steam and water alongside per-asset consumption are brought into one structure, so the plant’s energy flow sits on a single screen.
Analyze energy intensity
Compare energy used against output to find the periods and areas that spend more for the same work.
Manage peak and load
Identify when machines cluster and create a peak, spread the load, and bring down contracted demand and peak charges.
Aggregate ESG automatically
Consumption and emissions are aggregated with their sources, so reports are produced without manual work and the figures stay traceable.

Start quickly from an energy management system template
A new site does not have to design the structure from scratch. The energy management system (EnMS) template, refined across sites over thirty years, already includes the metering structure, intensity KPIs, ESG report formats, and anomaly and peak alert rules. Adjust it to your own assets and targets and you can begin operating on a proven structure right away.
- Metering structure by energy source and asset
- Energy intensity KPIs · dashboard
- ESG report formats
- Abnormal consumption · peak alert rules
Related use cases
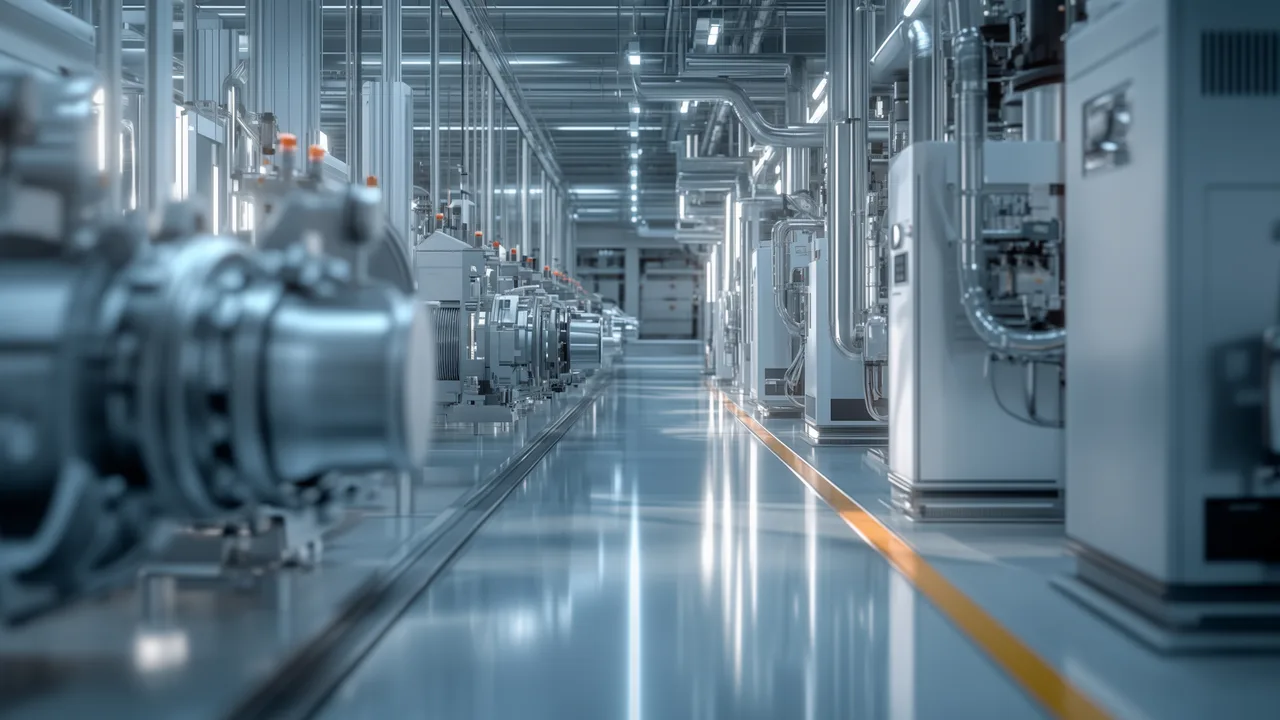
Read the early signs of motor failure
and cut unplanned downtime.
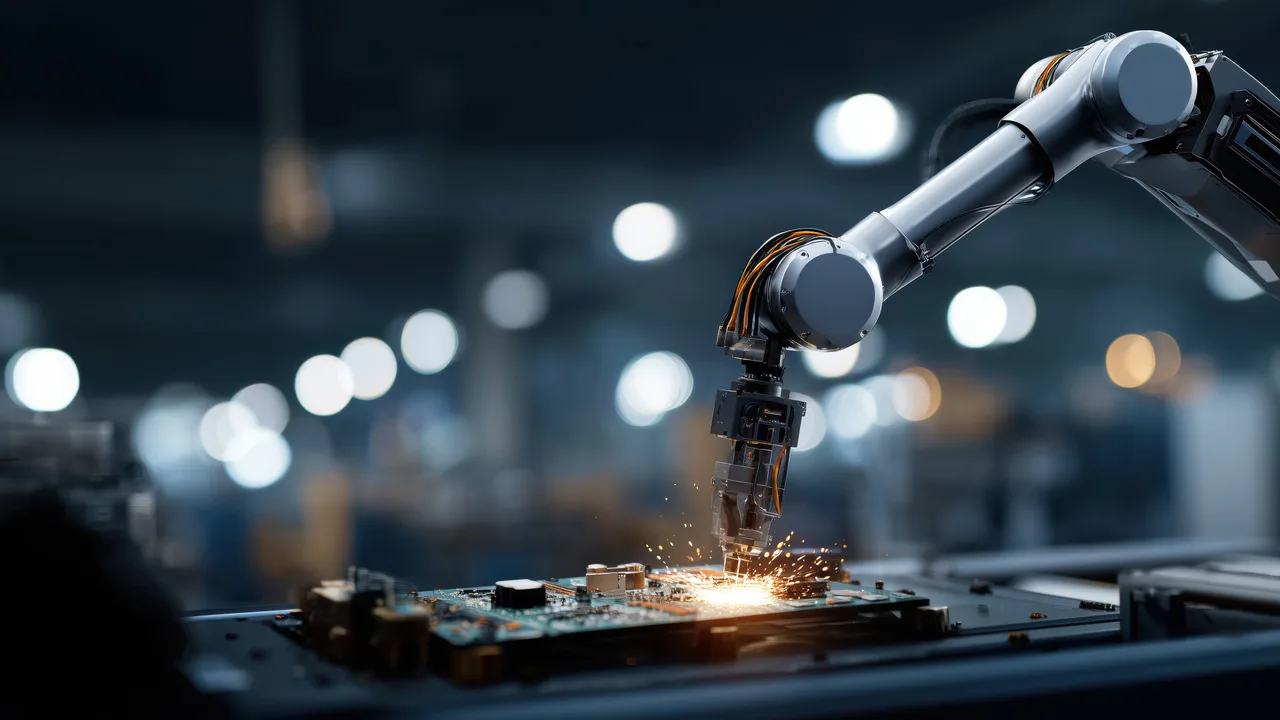
Bring scattered sensors into one structure
and read anomalies together.

Know when, where and how much you use,
and cut cost and risk.

Catch power quality faults you cannot see,
in real time, on the record.
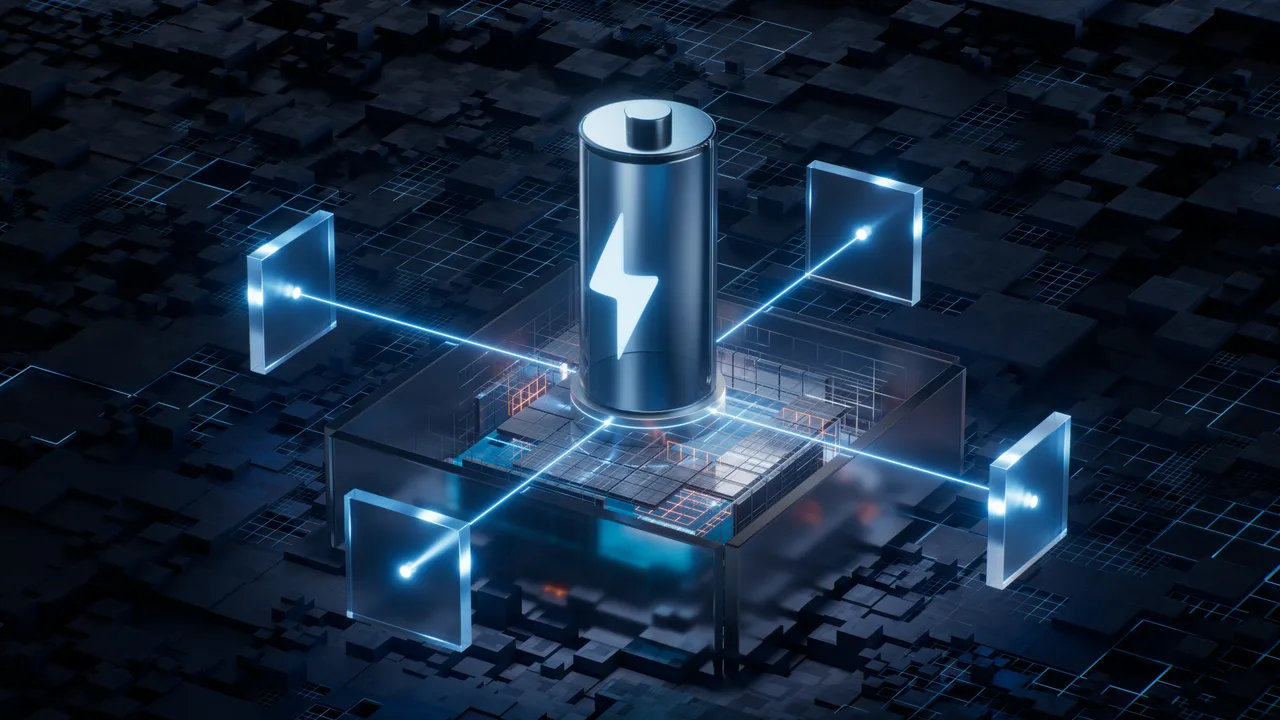
Find the hidden waste and the peaks,
and do the same work for less.
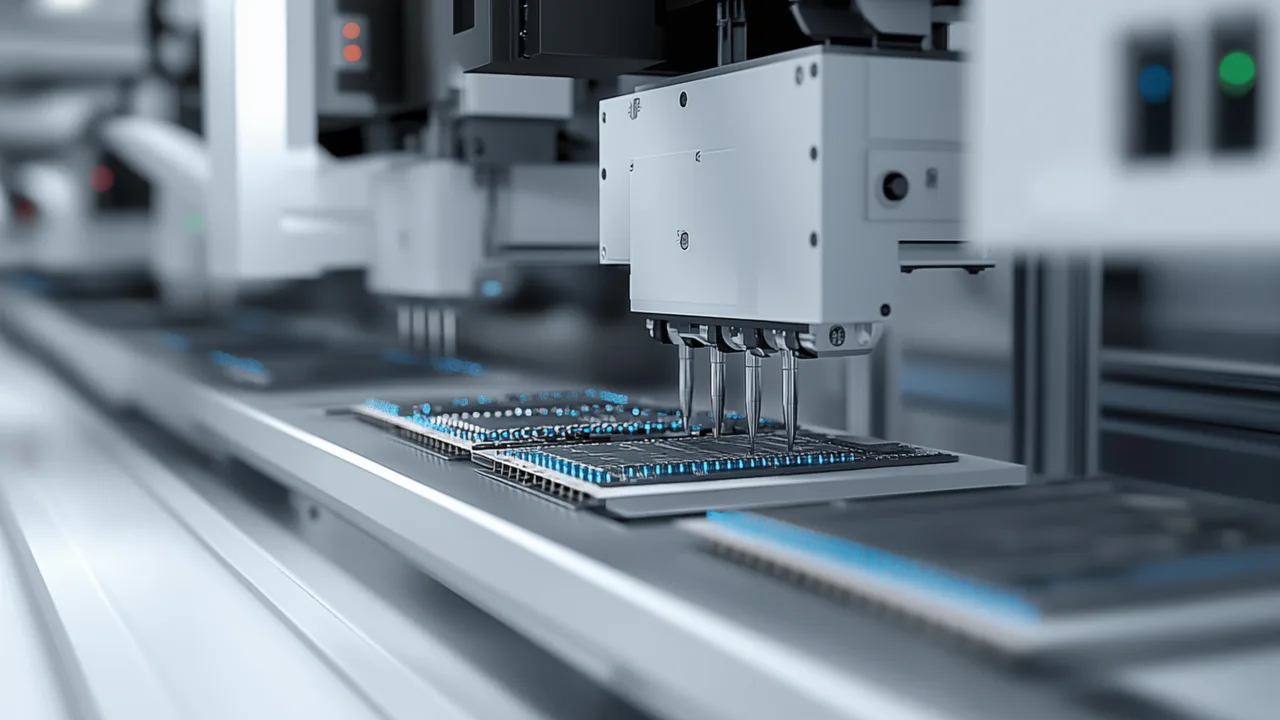
Read what the process data is signalling
and catch defects before they finish.